2018-12-08

Discretización de variables en R

Problema

Deseamos discretizar una variable, es decir, convertir una variable continua en discreta. Utilizamos el conjunto de datos College del paquete ISLR. Crearemos una nueva variable cualitativa llamada Elite, discretizando la variable Top10perc. Vamos a dividir las universidades en dos grupos basados en si la proporción de nuevos estudiantes provienen de entre el 10% de los mejores alumnos de sus institutos excede o no el 50%.

library(ISLR)
library(tidyverse)
glimpse(College)
Observations: 777
Variables: 18
$ Private      Yes, Yes, Yes, Yes, Yes, Yes, Yes, Yes, Yes, Yes, Yes, Ye...
$ Apps         1660, 2186, 1428, 417, 193, 587, 353, 1899, 1038, 582, 17...
$ Accept       1232, 1924, 1097, 349, 146, 479, 340, 1720, 839, 498, 142...
$ Enroll       721, 512, 336, 137, 55, 158, 103, 489, 227, 172, 472, 484...
$ Top10perc    23, 16, 22, 60, 16, 38, 17, 37, 30, 21, 37, 44, 38, 44, 2...
$ Top25perc    52, 29, 50, 89, 44, 62, 45, 68, 63, 44, 75, 77, 64, 73, 4...
$ F.Undergrad  2885, 2683, 1036, 510, 249, 678, 416, 1594, 973, 799, 183...
$ P.Undergrad  537, 1227, 99, 63, 869, 41, 230, 32, 306, 78, 110, 44, 63...
$ Outstate     7440, 12280, 11250, 12960, 7560, 13500, 13290, 13868, 155...
$ Room.Board   3300, 6450, 3750, 5450, 4120, 3335, 5720, 4826, 4400, 338...
$ Books        450, 750, 400, 450, 800, 500, 500, 450, 300, 660, 500, 40...
$ Personal     2200, 1500, 1165, 875, 1500, 675, 1500, 850, 500, 1800, 6...
$ PhD          70, 29, 53, 92, 76, 67, 90, 89, 79, 40, 82, 73, 60, 79, 3...
$ Terminal     78, 30, 66, 97, 72, 73, 93, 100, 84, 41, 88, 91, 84, 87, ...
$ S.F.Ratio    18.1, 12.2, 12.9, 7.7, 11.9, 9.4, 11.5, 13.7, 11.3, 11.5,...
$ perc.alumni  12, 16, 30, 37, 2, 11, 26, 37, 23, 15, 31, 41, 21, 32, 26...
$ Expend       7041, 10527, 8735, 19016, 10922, 9727, 8861, 11487, 11644...
$ Grad.Rate    60, 56, 54, 59, 15, 55, 63, 73, 80, 52, 73, 76, 74, 68, 5...

Solución

  1. Opción 1:Propuesta en el libro ISLR.
  2. Elite = rep("No", nrow(College))
    Elite[College$Top10perc > 50] = "Yes"
    Elite <- as.factor(Elite)
    college <- data.frame(College,  Elite)
    summary(college[, c("Top10perc", "Elite")])
    
    Podemos observar como 78 universidades contienen alumnos pertenecientes a la élite.

      Top10perc     Elite    
     Min.   : 1.00   No :699  
     1st Qu.:15.00   Yes: 78  
     Median :23.00            
     Mean   :27.56            
     3rd Qu.:35.00            
     Max.   :96.00    
    
  3. Opción 2: ifelse con paquete base y dplyr
  4. # base 
    College$Elite <- factor(ifelse(College$Top10perc > 50, "Yes", "No"))
    # dplyr
    library(dplyr)
    College <-
      college %>%
      mutate(Elite = factor(ifelse(College$Top10perc > 50, "Yes", "No")))
    
  5. Opción 3: vector lógico.
  6. Hay múltiples opciones. Presento dos ejemplos.

    college$Elite <- transform(College, Elite = Top10perc > 50)
    College$Elite <- College$Top10perc > 50
    

Entradas relacionadas

2018-12-03

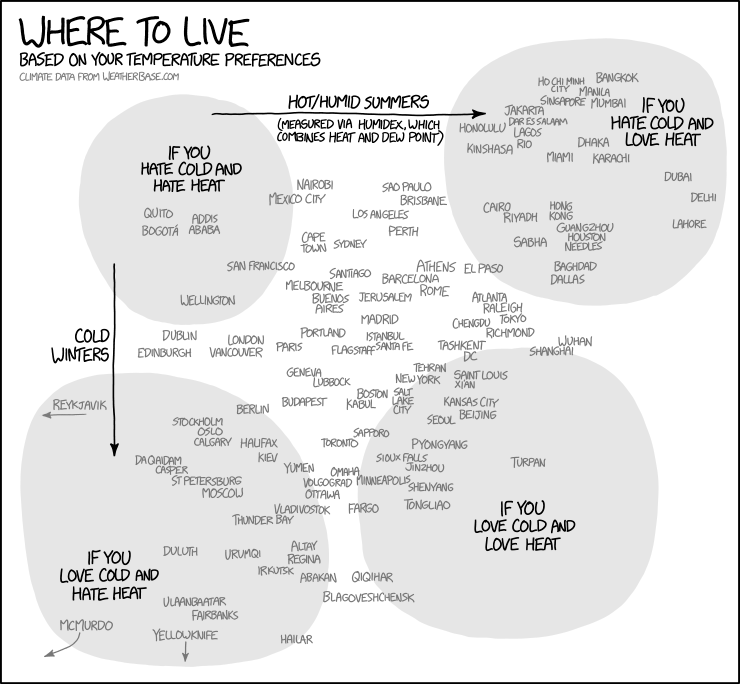
Dónde vivir en función de la temperatura (gráfico estilo xkcd)

Introducción

Hace aproximadamente un año, inspirados por el siguiente gráfico gráfico de xkcd, diferentes alternativas del mismo aparecieron en varios blogs, centradas generalmente en un país. El inicial de Maëlle Salmon para EUU, así como para España, Alemania, Países Bajos, Europa y Japón.

En primer lugar crearé mi versión para todo el mundo por continente. En segundo lugar para España incluyendo mapas con la ubicación de las ciudades.

Variables

En los gráficos y mapas vamos a emplear dos variables:

  1. Temperatura media en invierno
  2. Indice Humidex: wiki en español y en inglés.

Gráficos por continente

Creamos un gráfico para cada continente para evitar un apelotonamiento de ciudades. Dejamos la función facet_wrap, aunque cada gráfico está en un único panel, para obtener el subtítulo con el nombre del continente.

library(rvest)
library(tidyverse)
library(ggplot2)
library(ggrepel)
library(xkcd)
library(extrafont)
library(riem)

url <- "https://www.explainxkcd.com/wiki/index.php/1916:_Temperature_Preferences"
temp <- url %>% 
  read_html() %>% 
  html_node(xpath ='//*[@id="mw-content-text"]/div/table[2]') %>% 
  html_table()

# Para reproducir mismos resultados
set.seed(2015)

# Incluimos a Estambul dentro de Europa
temp <- temp %>% mutate(Continent = replace(Continent, City == "Istanbul", "Europe"))

# Bucle por continente
cont_list <- unique(temp$Continent)
plots <- list() # Guardamos gráficos en una lista
for (i in seq_along(cont_list)) { 
# Rangos de los ejes
rng <- temp %>% filter(Continent == cont_list[i])   
xrange <- c(floor(min(rng$Humidex, na.rm = TRUE)/10)*10, 
            ceiling(max(rng$Humidex, na.rm = TRUE)/10)*10)
yrange <- c(floor(min(rng$`Average low in coldest month (°C)`,na.rm = TRUE)/10)*10, 
            ceiling(max(rng$`Average low in coldest month (°C)`, na.rm = TRUE)/10)*10)
# Gráfico por continente
plot <- temp %>% filter(Continent == cont_list[i]) %>%
  ggplot(aes(Humidex, `Average low in coldest month (°C)`)) +
  geom_point() +
  geom_text_repel(aes(label = City),
                  family = "xkcd",
                  max.iter = 50000) +
  facet_wrap( ~ Continent) + 
  ggtitle("Where to live\nbased on your temperature preferences",
          subtitle = "Data source: www.explainxkcd.com") +
  xlab("Humidex: summer heat and humidity") +
  ylab("Avg. winter temperature in Celsius") +
  xkcdaxis(xrange = xrange,
           yrange = yrange) +
  scale_x_continuous(breaks = seq(min(xrange), max(xrange), by = 10)) +
  scale_y_continuous(breaks = seq(min(yrange), max(yrange), by = 10)) +
  theme_xkcd() +
  theme(text = element_text(size = 16, family = "xkcd")) +
  theme(text = element_text(size = 16, family = "xkcd"))
plots[[i]] = plot
print(plot) 
}

España

# Importamos nombres de aeoropuertos españoles
url <- "https://es.wikipedia.org/wiki/Anexo:Aeropuertos_de_Espa%C3%B1a"
spain_airports <- url %>% 
  read_html() %>% 
  html_node(xpath ='//*[@id="mw-content-text"]/div/table[1]') %>% 
  html_table()
spain_airports$aeropuertos <- str_extract(spain_airports$`Aeropuertos públicos`, "[^\\[]+")
# Editamos los nombres de los aeropueros manualmente
nombres <- read.csv("spain_airports_editados.csv")

# Temperaturas usando el paquete riem
summer_data <- map_df(riem_stations('ES__ASOS')$id, riem_measures,
                                date_start = "2018-06-01",
                                date_end = "2018-08-31")
winter_data <- map_df(riem_stations('ES__ASOS')$id, riem_measures,
                                date_start = "2017-12-01",
                                date_end = "2018-02-28")

# Conversión a grados centígrados
library(weathermetrics)
summer_data <- summer_data %>% 
                    mutate(tmpc = convert_temperature(tmpf,
                                                      old_metric = "f", 
                                                      new_metric = "c"),
                           dwpc = convert_temperature(dwpf,
                                                      old_metric = "f",
                                                      new_metric = "c"))
winter_data <- winter_data %>%
                     mutate(tmpc = convert_temperature(tmpf,
                               old_metric = "f",
                               new_metric = "c"),
                            dwpc = convert_temperature(dwpf, 
                               old_metric = "f",
                               new_metric = "c"))


# Cálculo de humidex
library(comf)
summer_data <- summer_data %>%
                    mutate(humidex = calcHumx(tmpc, relh)) %>% 
                   group_by(station, lon, lat) %>%
                   summarize(summer_avg_temp = mean(tmpc, na.rm = TRUE),
                      summer_humidex = mean(humidex, na.rm = TRUE))
winter_data <- winter_data %>%
                    group_by(station,lon, lat) %>%
                   summarize(winter_avg_temp = mean(tmpc, na.rm = TRUE))

# Unimos datos y nombres de aeropuertos
climate <- dplyr::left_join(winter_data, summer_data,
                             by = "station")
climate <- dplyr::left_join(climates, nombres)


# Gráfico
set.seed(2015)
xrange <- range(climate$summer_humidex)
yrange <- range(climate$winter_avg_temp)
climate %>% 
  ggplot(aes(summer_humidex, winter_avg_temp)) +
  geom_point() +
  geom_text_repel(aes(label = toupper(aeropuertos) ), 
                  family = "xkcd",
                  max.iter = 50000) +
  ggtitle("Where to live in Spain based on your temperature preferences",
          subtitle = "Data from airport weather stations 2017-2018") +
  xlab("Humidex: summer heat and humidity") +
  ylab("Avg. winter temperature in Celsius") +
  xkcdaxis(xrange = xrange,
           yrange = yrange) +
  theme_xkcd() +
  theme(text = element_text(size = 16, family = "xkcd")) +
  theme(text = element_text(size = 16, family = "xkcd"))

Mapas de España

Muestro dos tipos de gráfico. El invierno con una paleta basada en un color azul y el verano con la escala viridis. En este caso no disponemos de una tabla con las temperaturas, por lo que usamos el paquete riem (“R Iowa Environmental Mesonet”) creado por Maëlle Salmon que extrae la información de aquí.

  • Invierno
  • # Península
    set.seed(2015)
    climate_spain_map %>% 
      filter(lon > -10) %>% 
      ggplot(aes(lon, lat)) +
      geom_point(aes(color = winter_avg_temp), size = 3.5) +
      geom_text_repel(aes(label = aeropuertos),
                      family = "xkcd", size = 4.5,
                      max.iter = 50000) +
      geom_polygon(data = spain, aes(x = long, y = lat, group = group), 
                   fill = NA, color = "black") +
      coord_map() +
      labs(title = "Avg. Winter Temperature in Spain",
           subtitle = "Data from Iowa Environment Mesonet 2017-2018",
           x = "", y = "") +
      theme_xkcd() +
      theme(axis.text.x=element_blank(),
            axis.ticks.x=element_blank(),
            axis.text.y=element_blank(),
            axis.ticks.y=element_blank())+
      scale_color_gradient(low = "#08306B")
    
    # Canarias
    canary <- map_data(map = "world", region = "Canary Islands")
    climate_canary_map <- left_join(climates, lat_lon, by = "station")
    
    set.seed(2015)
    climate_canary_map %>% 
      filter(lon < -10) %>% 
      ggplot(aes(lon, lat)) +
      geom_point(aes(color = winter_avg_temp), size = 3.5) +
      geom_text_repel(aes(label = aeropuertos),
                      family = "xkcd", size = 4.5,
                      max.iter = 50000) +
      geom_polygon(data = canary, aes(x = long, y = lat, group = group), 
                   fill = NA, color = "black") +
      coord_map() +
      labs(title = "Avg. Winter Temperature in Canary Islands",
           subtitle = "Data from Iowa Environment Mesonet 2017-2018",
           x = "", y = "") +
      theme_xkcd() +
       theme(axis.text.x=element_blank(),
            axis.ticks.x=element_blank(),
            axis.text.y=element_blank(),
            axis.ticks.y=element_blank()) +
      scale_color_gradient(low = "#08306B")
    
  • Verano
  • # Península
    set.seed(2015)
    climate_spain_map %>% 
      filter(lon > -10) %>% 
      ggplot(aes(lon, lat)) +
      geom_point(aes(color = summer_humidex), size = 3.5) +
      geom_text_repel(aes(label = aeropuertos),
                      family = "xkcd", size = 4.5,
                      max.iter = 50000) +
      geom_polygon(data = spain, aes(x = long, y = lat, group = group), 
                   fill = NA, color = "black") +
      coord_map() +
      labs(title = "Avg. Summer Humidex in Spain",
           subtitle = "Data from Iowa Environment Mesonet 2017-2018",
           x = "", y = "") +
      theme_xkcd() +
      theme(axis.text.x=element_blank(),
            axis.ticks.x=element_blank(),
            axis.text.y=element_blank(),
            axis.ticks.y=element_blank()) +
        scale_color_viridis_c()
    
    # Canarias
    set.seed(2015)
    climate_canary_map %>% 
      filter(lon < -10) %>% 
      ggplot(aes(lon, lat)) +
      geom_point(aes(color = summer_humidex), size = 3.5) +
      geom_text_repel(aes(label = aeropuertos),
                      family = "xkcd", size = 4.5,
                      max.iter = 50000) +
      geom_polygon(data = canary, aes(x = long, y = lat, group = group), 
                   fill = NA, color = "black") +
      coord_map() +
      labs(title = "Avg. Summer Humidex in Canary Islands",
           subtitle = "Data from Iowa Environment Mesonet 2017-2018",
           x = "", y = "") +
      theme_xkcd() +
       theme(axis.text.x=element_blank(),
            axis.ticks.x=element_blank(),
            axis.text.y=element_blank(),
            axis.ticks.y=element_blank()) +
       scale_color_viridis_c()
    

    Entradas relacionadas

    2018-11-29

    Crear una pequeña base de datos de IMDb con R

    Introducción

    En una entrada anterior usamos la OMDb API para extraer con R información sobre películas o series de televisión. En esta ocasión queremos crear una pequeña base datos con el mismo paquete imdbapi.

    Solución

    Empleamos el paquete imdbapi que nos permite extraer dicha información. Si utilizamos la versión gratuita, tendremos una limitación de 1.000 peticiones al día.

    Lo primero que necesitamos es un vector con títulos de películas o de IMDbIDs (por ejemplo: para Vértigo la parte final de la dirección https://www.imdb.com/title/tt0052357/, la cadena tt0052357. En nuestro ejemplo usamos la encuesta de los críticos Sight & Sound de 2012, que contiene la columna const con dichos IMDbIDs .

    library(imdbapi)
    library(data.table)
    library(tidyverse)
    sight_sound <- read.csv("https://sites.google.com/site/nubededatosblogspotcom/Sight&Sound2012-CriticsPoll.txt", stringsAsFactors = FALSE)
    glimpse(sight_sound)
    
    Observations: 588
    Variables: 17
    $ const                          "tt0052357", "tt0033467", "tt004643...
    $ position                       1, 2, 3, 4, 5, 6, 7, 8, 9, 10, 11, ...
    $ created                        "Thu Aug 16 07:42:05 2012", "Thu Au...
    $ description                    NA, NA, NA, NA, NA, NA, NA, NA, NA,...
    $ modified                       "Thu Aug 16 07:42:05 2012", "Thu Au...
    $ Title                          "Vertigo", "Citizen Kane", "Tôkyô m...
    $ Directors                      "Alfred Hitchcock", "Orson Welles",...
    $ Title.type                     "Feature Film", "Feature Film", "Fe...
    $ IMDb.Rating                    8.5, 8.5, 8.2, 8.0, 8.3, 8.3, 8.0, ...
    $ PeacefulAnarchy.rated          10, 9, 10, 9, 9, 6, 6, 10, 8, 9, 6,...
    $ Runtime..mins.                 128, 119, 136, 110, 94, 160, 119, 6...
    $ Genres                         "mystery, romance, thriller", "dram...
    $ Year                           1958, 1941, 1953, 1939, 1927, 1968,...
    $ Num.Votes                      153502, 205699, 16219, 14872, 19188...
    $ Release.Date..month.day.year.  "1958-05-09", "1941-05-01", "1953-1...
    $ Id                             1, 2, 3, 4, 5, 6, 7, 8, 9, 10, 11, ...
    $ URL                            "http://www.imdb.com/title/tt005235...
    
    Empleamos la función lapply para extraer la información de todos los IMDbIDs.

    tt <-
      lapply(sight_sound$const, function(x) {
        return(tryCatch(
          find_by_id(
            x,
            type = NULL,
            year_of_release = NULL,
            plot = "full",
            include_tomatoes = TRUE,
            api_key = "12345678"
          ),
          error = function(e)
            NULL
        ))
      })
    df_sight_sound <- rbindlist(tt, fill = TRUE)
    df_sight_sound$Ratings <- as.character(df_sight_sound$Ratings)
    df_sight_sound <- as.data.frame(df_sight_sound)
    df_sight_sound %>% distinct(imdbID) %>% summarise(n= n())
        n
    1 586
    En una sola pasada suelen faltar algunos. En este caso nos faltan dos títulos. Repetiríamos el proceso hasta obtener todos los títulos.

    # Comprobamos los titulos no encontrados
    m <- subset(sight_sound, !(const %in% df_sight_sound$imdbID))$const 
    m
    [1] "tt0115751" "tt0032551"
    Finalmente procesamos el data frame para eliminar duplicados.

    df_sight_sound <- df_sight_sound %>% 
      filter(grepl("Internet",Ratings)) %>% 
      group_by(imdbID) %>% 
      distinct()
    
    # A tibble: 588 x 26
    # Groups:   imdbID [588]
       Title Year  Rated Released   Runtime Genre Director Writer Actors Plot 
                           
     1 Vert~ 1958  PG    1958-07-21 128 min Myst~ Alfred ~ "Alec~ James~ "Joh~
     2 Citi~ 1941  PG    1941-09-05 119 min Dram~ Orson W~ Herma~ Josep~ "A g~
     3 Toky~ 1953  NOT ~ 1972-03-13 136 min Drama Yasujir~ Kôgo ~ Chish~ An e~
     4 The ~ 1939  NOT ~ 1950-04-08 110 min Come~ Jean Re~ Jean ~ Nora ~ Avia~
     5 Sunr~ 1927  NOT ~ 1927-11-04 94 min  Dram~ F.W. Mu~ Carl ~ Georg~ "In ~
     6 2001~ 1968  G     1968-05-12 149 min Adve~ Stanley~ Stanl~ Keir ~ "\"2~
     7 The ~ 1956  PASS~ 1956-05-26 119 min Adve~ John Fo~ Frank~ John ~ Etha~
     8 Man ~ 1929  NOT ~ 1929-05-12 68 min  Docu~ Dziga V~ Dziga~ Mikha~ This~
     9 The ~ 1928  NOT ~ 1928-10-25 114 min Biog~ Carl Th~ Josep~ Maria~ The ~
    10 8½    1963  NOT ~ 1963-06-25 138 min Drama Federic~ Feder~ Marce~ Guid~
    # ... with 578 more rows, and 16 more variables: Language ,
    #   Country , Awards , Poster , Ratings ,
    #   Metascore , imdbRating , imdbVotes , imdbID ,
    #   Type , DVD , BoxOffice , Production , Website ,
    #   Response , totalSeasons 
    
    Y tendremos lista nuestra pequeña base de datos de IMDb. Si queremos exportar los resultados como csv:

    write.csv(df_sight_sound, "df_sight_sound.csv", row.names = FALSE)
    

    Entradas relacionadas

    Referencias

    2018-11-25

    Ocultar ceros en Excel

    Problema

    Deseamos ocultar los ceros de una hoja de Excel.

    Solución

    Opción 1 - Rango

    1. Seleccionamos el rango deseado y presionamos Ctrl + 1
    2. En el cuadro de diálogo Formato de celda, seleccionamos Número y en Tipo tecleamos: 0;;
    Opción 2 - Hoja
    1. Clic en Archivo > Opciones > Avanzadas.
    2. En Mostrar opciones para esta hoja, seleccionamos la hoja deseada, y quitamos la marca de selección de Mostrar un cero en celdas que tienen un valor cero
    3. Esta segunda opción es menos flexible pues no se aplica a un rango sino a toda la o
    Opción 3 - VBA: hojas o libros
    1. Abrimos el Editor de Microsoft Visual Basic: Alt+F11
    2. Copiamos las siguiente subrutinas en un módulo: una para ocultar y otra para mostrar los ceros
    3. Sub Ocultar_ceros()
          ActiveWindow.DisplayZeros = False
      End Sub
      
      Sub Mostrar_ceros()
          ActiveWindow.DisplayZeros = True
      End Sub
      
      Si queremos ocultar o mostrar los ceros de todas las hojas:

      Sub Ocultar_ceros()
          Worksheets.Select
          ActiveWindow.DisplayZeros = False
      End Sub
      
      Sub Mostrar_ceros()
          Worksheets.Select
          ActiveWindow.DisplayZeros = True
      End Sub
      

    Resultado

    Entradas relacionadas

    2018-11-10

    Extraer información de la OMDb API con R

    Problema

    Queremos extraer con R información sobre películas o series de televisión usando la OMDb API.

    Solución

    Empleamos el paquete imdbapi que nos permite extraer dicha información. Si utilizamos la versión gratuita, tendremos una limitación de 1.000 peticiones al día. El paquete imdbapi nos permite:

    • Búsqueda por imdb id
    • library(imdbapi)
      find_by_id("tt0107692", type = NULL, year_of_release = NULL, plot = "full", include_tomatoes = FALSE, api_key = "12345678")
      
      # A tibble: 2 x 25
        Title Year  Rated Released   Runtime Genre Director Writer Actors Plot 
                            
      1 Ninj~ 1993  NOT ~ 1993-06-05 94 min  Anim~ Yoshiak~ Yoshi~ Kôich~ A Jo~
      2 Ninj~ 1993  NOT ~ 1993-06-05 94 min  Anim~ Yoshiak~ Yoshi~ Kôich~ A Jo~
      # ... with 15 more variables: Language , Country , Awards ,
      #   Poster , Ratings , Metascore , imdbRating ,
      #   imdbVotes , imdbID , Type , DVD , BoxOffice ,
      #   Production , Website , Response 
      
    • Búsqueda por título
    • find_by_title("vertigo", type = NULL, year_of_release = NULL, plot = "full", include_tomatoes = FALSE, api_key = "12345678")
      
      # A tibble: 3 x 25
        Title Year  Rated Released   Runtime Genre Director Writer Actors Plot 
                            
      1 Vert~ 1958  PG    1958-07-21 128 min Myst~ Alfred ~ "Alec~ James~ "Joh~
      2 Vert~ 1958  PG    1958-07-21 128 min Myst~ Alfred ~ "Alec~ James~ "Joh~
      3 Vert~ 1958  PG    1958-07-21 128 min Myst~ Alfred ~ "Alec~ James~ "Joh~
      # ... with 15 more variables: Language , Country , Awards ,
      #   Poster , Ratings , Metascore , imdbRating ,
      #   imdbVotes , imdbID , Type , DVD , BoxOffice ,
      #   Production , Website , Response 
      
    • Además cuenta con diferentes funciones para extraer una información específica: actores, países, directores, géneros o escritores.
    • get_actors(find_by_title("vertigo", api_key = "12345678"))
      [1] "James Stewart"      "Kim Novak"          "Barbara Bel Geddes"
      [4] "Tom Helmore"  
      get_countries(find_by_title("vertigo", api_key = "12345678"))
      [1] "USA"
      get_directors(find_by_title("vertigo", api_key = "12345678"))
      [1] "Alfred Hitchcock"
      get_genres(find_by_title("vertigo", api_key = "12345678"))
      [1] "Mystery"  "Romance"  "Thriller"
      get_writers(find_by_title("vertigo", api_key = "12345678"))
      [1] "Alec Coppel (screenplay by)"                                  
      [2] "Samuel A. Taylor (screenplay by)"                             
      [3] "Pierre Boileau (based on the novel \"D'Entre Les Morts\" by)" 
      [4] "Thomas Narcejac (based on the novel \"D'Entre Les Morts\" by)"
      
  • Cargar la imagen del póster
  • library(RCurl)
    df <- find_by_title("Batman Ninja", type = NULL, year_of_release = NULL, plot = "full", include_tomatoes = FALSE, api_key = "12345678")
    plot(0:1,
         0:1,
         type = "n",
         ann = FALSE,
         axes = FALSE)
    my_image <-  readJPEG(getURLContent(df$Poster[1]))
    rasterImage(my_image, 0, 0, 1, 1)
    

    Notas

    Al inspeccionar las funciones anteriores que comienzan por get, podemos ver que simplemente extraen un subconjunto de datos del objeto omdb generado por la búsqueda por imdb id o título.

    function (omdb) 
    {
      if (!inherits(omdb, "omdb")) {
        message("get_actors() expects an omdb object")
        return(NULL)
      }
      if ("Actors" %in% names(omdb)) {
        str_split(omdb$Actors, ",[ ]*")[[1]]
      }
    }
    
    Cada petición con find_by_id o find_by_title, generará una fila por cada página de las valoraciones (Ratings) disponibles encontradas. Por ejemplo, Vértigo devolverá 3 filas con las valoraciones de IMDb, Rotten Tomatoes y Metacritic. En cambio Ninja Scroll o Batman Ninja solamente devolverá dos filas: IMDb y Rotten Tomatoes. Las variables extraídas son:

    Classes ‘omdb’, ‘tbl_df’, ‘tbl’ and 'data.frame': 2 obs. of  25 variables:
     $ Title     : chr  "Batman Ninja" "Batman Ninja"
     $ Year      : chr  "2018" "2018"
     $ Rated     : chr  "PG-13" "PG-13"
     $ Released  : Date, format: "2018-04-24" "2018-04-24"
     $ Runtime   : chr  "85 min" "85 min"
     $ Genre     : chr  "Animation, Action" "Animation, Action"
     $ Director  : chr  "Junpei Mizusaki" "Junpei Mizusaki"
     $ Writer    : chr  "Kazuki Nakashima (screenplay), Leo Chu (English screenplay), Eric Garcia (English screenplay), Bob Kane (charac"| __truncated__ "Kazuki Nakashima (screenplay), Leo Chu (English screenplay), Eric Garcia (English screenplay), Bob Kane (charac"| __truncated__
     $ Actors    : chr  "Kôichi Yamadera, Wataru Takagi, Ai Kakuma, Rie Kugimiya" "Kôichi Yamadera, Wataru Takagi, Ai Kakuma, Rie Kugimiya"
     $ Plot      : chr  "Batman, along with a number of his allies and adversaries, finds himself transplanted from modern Gotham City to feudal Japan." "Batman, along with a number of his allies and adversaries, finds himself transplanted from modern Gotham City to feudal Japan."
     $ Language  : chr  "Japanese, English" "Japanese, English"
     $ Country   : chr  "Japan, USA" "Japan, USA"
     $ Awards    : chr  "N/A" "N/A"
     $ Poster    : chr  "https://m.media-amazon.com/images/M/MV5BYmFhYzZhYzgtZjZiYS00NWEwLWFhYTUtN2UxM2FmYzdhNDUyXkEyXkFqcGdeQXVyNDk2Nzc"| __truncated__ "https://m.media-amazon.com/images/M/MV5BYmFhYzZhYzgtZjZiYS00NWEwLWFhYTUtN2UxM2FmYzdhNDUyXkEyXkFqcGdeQXVyNDk2Nzc"| __truncated__
     $ Ratings   :List of 2
      ..$ :List of 2
      .. ..$ Source: chr "Internet Movie Database"
      .. ..$ Value : chr "5.7/10"
      ..$ :List of 2
      .. ..$ Source: chr "Rotten Tomatoes"
      .. ..$ Value : chr "79%"
     $ Metascore : chr  "N/A" "N/A"
     $ imdbRating: num  5.7 5.7
     $ imdbVotes : num  9759 9759
     $ imdbID    : chr  "tt7451284" "tt7451284"
     $ Type      : chr  "movie" "movie"
     $ DVD       : Date, format: "2018-05-08" "2018-05-08"
     $ BoxOffice : chr  "N/A" "N/A"
     $ Production: chr  "DC Comics" "DC Comics"
     $ Website   : chr  "N/A" "N/A"
     $ Response  : chr  "True" "True"
    

    Entradas relacionadas

    Referencias

    Nube de datos