Mostrando entradas con la etiqueta stackoverflow. Mostrar todas las entradas

2020-11-24

How to select all columns in dplyr

Title

Problem

We want to select all variables in a data frame using dplyr.

Solution

select(iris, everything())
# Using the pipe operator %>%
iris %>% select(everything())

Notes

The function select( ) subsets columns based on their names and other features. We can use the function everything( ) a selection helper to select all variables.

Results

Source: local data frame [150 x 5]

   Sepal.Length Sepal.Width Petal.Length Petal.Width Species
1           5.1         3.5          1.4         0.2  setosa
2           4.9         3.0          1.4         0.2  setosa
3           4.7         3.2          1.3         0.2  setosa
4           4.6         3.1          1.5         0.2  setosa
5           5.0         3.6          1.4         0.2  setosa
6           5.4         3.9          1.7         0.4  setosa
7           4.6         3.4          1.4         0.3  setosa
8           5.0         3.4          1.5         0.2  setosa
9           4.4         2.9          1.4         0.2  setosa
10          4.9         3.1          1.5         0.1  setosa
..          ...         ...          ...         ...     ...

References

2019-05-09

How to make barplot bars with the same bar width in R

Title

Problem

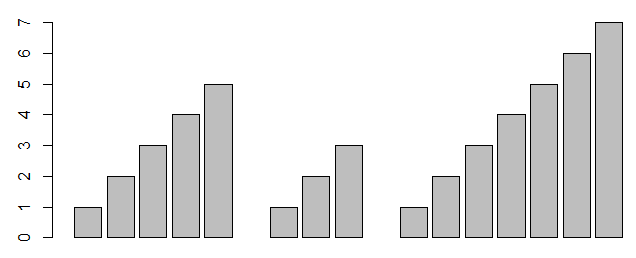
We have three barplots with a different number of bars in each of them, and we want them to have the same bar width.

par(mfrow=c(1,3));
par(mar=c(9,6,4,2)+0.1);
barcenter1<- barplot(c(1,2,3,4,5));
mtext("Average Emergent", side=2, line=4);
par(mar=c(9,2,4,2)+0.1);
barcenter2<- barplot(c(1,2,3));
par(mar=c(9,2,4,2)+0.1);
barcenter3<- barplot(c(1,2,3,4,5,6,7));

Solution

  • First try
  • Using the arguments xlim = c(0, 1), width = 0.1 the problem is partially corrected. However, you can notice that the bar width is not exactly the same.

    width - optional vector of bar widths. Re-cycled to length the number of bars drawn. Specifying a single value will have no visible effect unless xlim is specified.

    par(mfrow = c(1, 3))
    par(mar = c(9, 6, 4, 2) + 0.1)
    barcenter1 <- barplot(c(1, 2, 3, 4, 5), xlim = c(0, 1), width = 0.1)
    mtext("Average Emergent", side = 2, line = 4)
    par(mar = c(9, 2, 4, 2) + 0.1)
    barcenter2 <- barplot(c(1, 2, 3), xlim = c(0, 1), width = 0.1)
    par(mar = c(9, 2, 4, 2) + 0.1)
    barcenter1 <- barplot(c(1, 2, 3, 4, 5, 6, 7), xlim = c(0, 1), width = 0.1)
    
  • Second try/li>

    We add zeros as placeholders.

    par(mfrow = c(1, 1)) # Reiniciamos los parámetros gráficos
    df <- data.frame(barcenter1 = c(1, 2, 3, 4, 5, 0, 0), 
                     barcenter2 = c(1, 2, 3, 0, 0, 0, 0), 
                     barcenter3 = c(1, 2, 3, 4, 5, 6, 7))
    barplot(as.matrix(df), beside = TRUE)
    
    With ggplot2:

    df <- data.frame(x = c(1, 2, 3, 4, 5, 1, 2, 3, 1, 2, 3, 4, 5, 6, 7), 
                     y = c(rep("bar1", 5), rep("bar2", 3), rep("bar3", 7)))                                                                                         
    library(ggplot2)
    ggplot(data = df, aes(x = x, y = x)) + 
      geom_bar(stat = "identity") + 
      facet_grid(~y) 
    
  • Alternative
  • If instead of three separate barplots we'd like to plot them with an empty space between them, we plot a single barplot with two NAs as delimiters. Si en lugar de tres gráficos propiamente dichos queremos mostrarlos sin que haya separación por las barras en blanco entre ellas, creamos un gráfico único con espacio con dos separaciones por NAs.

    x <- c(1, 2, 3, 4, 5, NA, 1, 2, 3, NA, 1, 2, 3, 4, 5, 6, 7)
    barplot(x)
    

    References

    2016-08-24

    Crear una nueva columna incremental basándonos en otra en R

    Title

    Problema

    Partimos del siguiente data frame:

      Name Grade
    1 John     C
    2 John    C+
    3 John     C
    4 John     B
    5 John     A
    6 John    A+
    7  Kat     B
    8  Kat     C
    9  Kat     B
    

    Queremos añadir una nueva columna, months, que comience con 3 y continúe con sus múltiplos.

  • Datos originales
  • df <- structure(list(Name = c("John", "John", "John", "John", "John", 
    "John", "Kat", "Kat", "Kat"), Grade = c("C", "C+", "C", "B", 
    "A", "A+", "B", "C", "B")), .Names = c("Name", "Grade"), class = "data.frame", row.names = c(NA, 
    -9L))
    

    Solución

    • Paquete base
    • Usando seq con ave, y 1:nrow(df) en lugar de ff$Name para evitar un vector de tipo carácter como resultado.

      df$months <- ave(1:nrow(df), df$Name, FUN = seq)*3
      
       Name Grade months
      1 John     C      3
      2 John    C+      6
      3 John     C      9
      4 John     B     12
      5 John     A     15
      6 John    A+     18
      7  Kat     B      3
      8  Kat     C      6
      9  Kat     B      9
      
    • dplyr
    • library(dplyr)
      df %>% group_by(Name) %>% mutate(Months=3*seq(n()))
      
    • data.table
    • library(data.table)
      setDT(df)[, Months := 3* seq_len(.N) , by = Name]
      

    Referencias

    2015-09-03

    Seleccionar un porcentaje de filas un data frame en R

    Title

    Problema

    Queremos seleccionar un porcentajes de filas de un data frame.

    Soluciones

    Utilizamos el conjunto de datos ToothGrowth, que cuenta con 60 filas. Lo partiremos en dos, la primera con un 70% de las filas (42) y la segunda con un 30% (18 filas). Aunque en este ejemplo no es necesario, empleamos la función round, para que en el caso de que por ejemplo el número de filas sea 6,6 devuelva 7 filas en lugar de 6.

  • head y tal
  • head(ToothGrowth, round(nrow(ToothGrowth)*0.7))
    tail(ToothGrowth, round(nrow(ToothGrowth)*0.3))
    
  • Filtrando con índices
  • porcentaje = round(0.7*nrow(ToothGrowth))
    ToothGrowth[1:porcentaje,]
    ToothGrowth[-(1:porcentaje),]
    
  • Usando dplyr
  • porcentaje = round(0.7*nrow(ToothGrowth))
    library(dplyr)
    slice(ToothGrowth, 1:porcentaje)
    slice(ToothGrowth, -(1:porcentaje))

    Resultado

    Source: local data frame [42 x 3]
    
        len supp dose
    1   4.2   VC  0.5
    2  11.5   VC  0.5
    3   7.3   VC  0.5
    4   5.8   VC  0.5
    5   6.4   VC  0.5
    6  10.0   VC  0.5
    7  11.2   VC  0.5
    8  11.2   VC  0.5
    9   5.2   VC  0.5
    10  7.0   VC  0.5
    ..  ...  ...  ...
    
    Source: local data frame [18 x 3]
    
        len supp dose
    1  23.6   OJ    1
    2  26.4   OJ    1
    3  20.0   OJ    1
    4  25.2   OJ    1
    5  25.8   OJ    1
    6  21.2   OJ    1
    7  14.5   OJ    1
    8  27.3   OJ    1
    9  25.5   OJ    2
    10 26.4   OJ    2
    11 22.4   OJ    2
    12 24.5   OJ    2
    13 24.8   OJ    2
    14 30.9   OJ    2
    15 26.4   OJ    2
    16 27.3   OJ    2
    17 29.4   OJ    2
    18 23.0   OJ    2
    

    Entradas relacionadas

    Referencias

    2015-08-30

    ¿Cómo seleccionar todas las columnas de un data frame con dplyr?

    Title

    Problema

    Queremos seleccionar todas las columnas de un data frame con el paquete dplyr.

    Respondemos a una duda planteada en stackoverflow. Otra cuestión sería por qué razón querríamos hacer algo así en lugar simplemente utilizar todo el data frame tecleando su nombre.

    Soluciones

    select(iris, everything())
    # Usando el operador %>%
    iris %>% select(everything())
    
    rename(iris)
    

    Notas

    select( ) selecciona solamente aquellas variables que indiquemos; rename( ) selecciona todas las variables. Si empleamos select, introducimos everything( ) que es una de las funciones especiales que solamente funcionan dentro de select.

    Resultado

    Source: local data frame [150 x 5]
    
       Sepal.Length Sepal.Width Petal.Length Petal.Width Species
    1           5.1         3.5          1.4         0.2  setosa
    2           4.9         3.0          1.4         0.2  setosa
    3           4.7         3.2          1.3         0.2  setosa
    4           4.6         3.1          1.5         0.2  setosa
    5           5.0         3.6          1.4         0.2  setosa
    6           5.4         3.9          1.7         0.4  setosa
    7           4.6         3.4          1.4         0.3  setosa
    8           5.0         3.4          1.5         0.2  setosa
    9           4.4         2.9          1.4         0.2  setosa
    10          4.9         3.1          1.5         0.1  setosa
    ..          ...         ...          ...         ...     ...
    

    Referencias

    2015-08-24

    Seleccionar sólo las columnas que contengan NA en R

    Title

    Problema

    De un data frame deseamos seleccionar aquellas columnas que contengan algún valor NA.

    i3 <- c(1, 1, 1, 1, 2, 2)
    i2 <- c(NA, 1, 1, 1, 2, 2)
    i1 <- c(1, NA, 2, 4, 5, 3)
    newdat1 <- data.frame(i3, i2, i1)
    newdat1
    
      i3 i2 i1
    1  1 NA  1
    2  1  1 NA
    3  1  1  2
    4  1  1  4
    5  2  2  5
    6  2  2  3
    

    Soluciones

    De mayor a menor eficiencia.

  • sapply
  • newdat1[, sapply(newdat1, anyNA), drop = FALSE]
    
      i2 i1
    1 NA  1
    2  1 NA
    3  1  2
    4  1  4
    5  2  5
    6  2  3
    
  • colSums
  • newdat1[,is.na(colSums(newdat1))]
    
  • complete.cases
  • Mi alternativa propuesta. Transponemos el data frame y con complete.cases obtenemos un índice lógico (TRUE, FALSE, FALSE) con las columnas tienen algún NA. Como son aquellas que deseamos con incluir, con el operador ! invertimos el vector lógico anterior (FALSE, TRUE, TRUE) quedándonos con la segunda y tercera columnas.

    newdat1[!complete.cases(t(newdat1))]
    
  • apply
  • apply(newdat1, 2, function(x) sum(is.na(x)) == 0 )
    

    Referencias

    2015-08-09

    Calcular el porcentaje del total de la columna en R

    Title

    Problema

    Queremos calcular el porcentaje del total de la columna de un data frame en R. En nuestro ejemplo una columna con: 7/397, 23/397 y así sucesivamente.

        x freq
    1 Jan    7
    2 Feb   23
    3 Mar   86
    4 Apr  281
    
    Código para crear el data frame anterior:

    df <- read.table(text = "x    freq
                            Jan   7
                            Feb   23
                            Mar   86
                            Apr   281", 
                            header =TRUE)
    

    Solución

    Empleamos la función prop.table para crear esa columna.

    df$prob <- prop.table(df$freq)
    # En porcentajes con dos decimales:
    df$prob <- round(prop.table(df$freq), 4)*100
    
        x freq       prob
    1 Jan    7 0.01763224
    2 Feb   23 0.05793451
    3 Mar   86 0.21662469
    4 Apr  281 0.70780856
    
    Si deseamos el porcentaje de un mes específico:
    prop.table(df$freq)[df$x == "Feb"] 
    
     [1] 0.05793451
    

    Alternativas

    • Paquete base
    • df$prob <- df$freq/sum(df$freq)
      
    • dplyr
    • library(dplyr)
      df %>% mutate(prob = prop.table(freq))
      # O también
      df %>% mutate(prob = freq / sum(freq))
      
      Un mes específico:
      df %>% filter(x == "Feb")
      
          x freq       prob
      1 Feb   23 0.05793451
      

    Referencias

    Nube de datos