Mostrando entradas con la etiqueta mfrow. Mostrar todas las entradas

2019-05-09

How to make barplot bars with the same bar width in R

Title

Problem

We have three barplots with a different number of bars in each of them, and we want them to have the same bar width.

par(mfrow=c(1,3));
par(mar=c(9,6,4,2)+0.1);
barcenter1<- barplot(c(1,2,3,4,5));
mtext("Average Emergent", side=2, line=4);
par(mar=c(9,2,4,2)+0.1);
barcenter2<- barplot(c(1,2,3));
par(mar=c(9,2,4,2)+0.1);
barcenter3<- barplot(c(1,2,3,4,5,6,7));

Solution

  • First try
  • Using the arguments xlim = c(0, 1), width = 0.1 the problem is partially corrected. However, you can notice that the bar width is not exactly the same.

    width - optional vector of bar widths. Re-cycled to length the number of bars drawn. Specifying a single value will have no visible effect unless xlim is specified.

    par(mfrow = c(1, 3))
    par(mar = c(9, 6, 4, 2) + 0.1)
    barcenter1 <- barplot(c(1, 2, 3, 4, 5), xlim = c(0, 1), width = 0.1)
    mtext("Average Emergent", side = 2, line = 4)
    par(mar = c(9, 2, 4, 2) + 0.1)
    barcenter2 <- barplot(c(1, 2, 3), xlim = c(0, 1), width = 0.1)
    par(mar = c(9, 2, 4, 2) + 0.1)
    barcenter1 <- barplot(c(1, 2, 3, 4, 5, 6, 7), xlim = c(0, 1), width = 0.1)
    
  • Second try/li>

    We add zeros as placeholders.

    par(mfrow = c(1, 1)) # Reiniciamos los parámetros gráficos
    df <- data.frame(barcenter1 = c(1, 2, 3, 4, 5, 0, 0), 
                     barcenter2 = c(1, 2, 3, 0, 0, 0, 0), 
                     barcenter3 = c(1, 2, 3, 4, 5, 6, 7))
    barplot(as.matrix(df), beside = TRUE)
    
    With ggplot2:

    df <- data.frame(x = c(1, 2, 3, 4, 5, 1, 2, 3, 1, 2, 3, 4, 5, 6, 7), 
                     y = c(rep("bar1", 5), rep("bar2", 3), rep("bar3", 7)))                                                                                         
    library(ggplot2)
    ggplot(data = df, aes(x = x, y = x)) + 
      geom_bar(stat = "identity") + 
      facet_grid(~y) 
    
  • Alternative
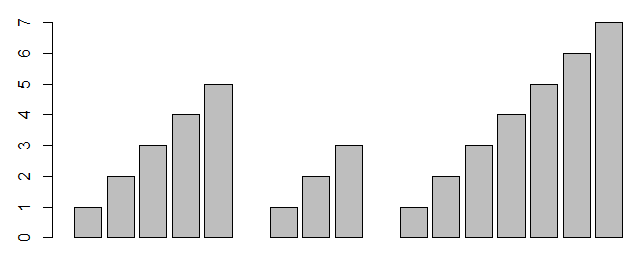
  • If instead of three separate barplots we'd like to plot them with an empty space between them, we plot a single barplot with two NAs as delimiters. Si en lugar de tres gráficos propiamente dichos queremos mostrarlos sin que haya separación por las barras en blanco entre ellas, creamos un gráfico único con espacio con dos separaciones por NAs.

    x <- c(1, 2, 3, 4, 5, NA, 1, 2, 3, NA, 1, 2, 3, 4, 5, 6, 7)
    barplot(x)
    

    References

    2015-07-23

    Gráficos de barras en R con el mismo ancho de barra

    Title

    Problema

    Tenemos tres gráficos con distintos números de barras y queremos que el ancho de la barra sea el mismo en las tres.

    par(mfrow=c(1,3));
    par(mar=c(9,6,4,2)+0.1);
    barcenter1<- barplot(c(1,2,3,4,5));
    mtext("Average Emergent", side=2, line=4);
    par(mar=c(9,2,4,2)+0.1);
    barcenter2<- barplot(c(1,2,3));
    par(mar=c(9,2,4,2)+0.1);
    barcenter3<- barplot(c(1,2,3,4,5,6,7));
    

    Solución

    • Primer intento
    • Corregimos parcialmente el problema con los argumentos xlim = c(0, 1), width = 0.1. Sin embargo se puede apreciar que el ancho no es exactamente el mismo.

      width - optional vector of bar widths. Re-cycled to length the number of bars drawn. Specifying a single value will have no visible effect unless xlim is specified.

      par(mfrow = c(1, 3))
      par(mar = c(9, 6, 4, 2) + 0.1)
      barcenter1 <- barplot(c(1, 2, 3, 4, 5), xlim = c(0, 1), width = 0.1)
      mtext("Average Emergent", side = 2, line = 4)
      par(mar = c(9, 2, 4, 2) + 0.1)
      barcenter2 <- barplot(c(1, 2, 3), xlim = c(0, 1), width = 0.1)
      par(mar = c(9, 2, 4, 2) + 0.1)
      barcenter1 <- barplot(c(1, 2, 3, 4, 5, 6, 7), xlim = c(0, 1), width = 0.1)
      
    • Segundo intento
    • Introducimos ceros para que respete el espacio.

      par(mfrow = c(1, 1)) # Reiniciamos los parámetros gráficos
      df <- data.frame(barcenter1 = c(1, 2, 3, 4, 5, 0, 0), 
                       barcenter2 = c(1, 2, 3, 0, 0, 0, 0), 
                       barcenter3 = c(1, 2, 3, 4, 5, 6, 7))
      barplot(as.matrix(df), beside = TRUE)
      
      Con ggplot2:

      df <- data.frame(x = c(1, 2, 3, 4, 5, 1, 2, 3, 1, 2, 3, 4, 5, 6, 7), 
                       y = c(rep("bar1", 5), rep("bar2", 3), rep("bar3", 7)))                                                                                         
      library(ggplot2)
      ggplot(data = df, aes(x = x, y = x)) + 
        geom_bar(stat = "identity") + 
        facet_grid(~y) 
      
  • Alternativa
  • Si en lugar de tres gráficos propiamente dichos queremos mostrarlos sin que haya separación por las barras en blanco entre ellas, creamos un gráfico único con espacio con dos separaciones por NAs.

    x <- c(1, 2, 3, 4, 5, NA, 1, 2, 3, NA, 1, 2, 3, 4, 5, 6, 7)
    barplot(x)
    

    Referencias

    Nube de datos