Problema
Tenemos tres gráficos con distintos números de barras y queremos que el ancho de la barra sea el mismo en las tres.
par(mfrow=c(1,3));
par(mar=c(9,6,4,2)+0.1);
barcenter1<- barplot(c(1,2,3,4,5));
mtext("Average Emergent", side=2, line=4);
par(mar=c(9,2,4,2)+0.1);
barcenter2<- barplot(c(1,2,3));
par(mar=c(9,2,4,2)+0.1);
barcenter3<- barplot(c(1,2,3,4,5,6,7));
Solución
- Primer intento
Corregimos parcialmente el problema con los argumentos xlim = c(0, 1), width = 0.1. Sin embargo se puede apreciar que el ancho no es exactamente el mismo.
width - optional vector of bar widths. Re-cycled to length the number of bars drawn. Specifying a single value will have no visible effect unless xlim is specified.
par(mfrow = c(1, 3))
par(mar = c(9, 6, 4, 2) + 0.1)
barcenter1 <- barplot(c(1, 2, 3, 4, 5), xlim = c(0, 1), width = 0.1)
mtext("Average Emergent", side = 2, line = 4)
par(mar = c(9, 2, 4, 2) + 0.1)
barcenter2 <- barplot(c(1, 2, 3), xlim = c(0, 1), width = 0.1)
par(mar = c(9, 2, 4, 2) + 0.1)
barcenter1 <- barplot(c(1, 2, 3, 4, 5, 6, 7), xlim = c(0, 1), width = 0.1)
Introducimos ceros para que respete el espacio.
par(mfrow = c(1, 1)) # Reiniciamos los parámetros gráficos
df <- data.frame(barcenter1 = c(1, 2, 3, 4, 5, 0, 0),
                 barcenter2 = c(1, 2, 3, 0, 0, 0, 0),
                 barcenter3 = c(1, 2, 3, 4, 5, 6, 7))
barplot(as.matrix(df), beside = TRUE)
df <- data.frame(x = c(1, 2, 3, 4, 5, 1, 2, 3, 1, 2, 3, 4, 5, 6, 7),
                 y = c(rep("bar1", 5), rep("bar2", 3), rep("bar3", 7)))
library(ggplot2)
ggplot(data = df, aes(x = x, y = x)) +
  geom_bar(stat = "identity") +
  facet_grid(~y)
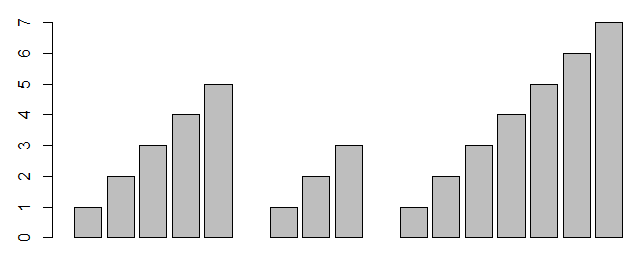
Si en lugar de tres gráficos propiamente dichos queremos mostrarlos sin que haya separación por las barras en blanco entre ellas, creamos un gráfico único con espacio con dos separaciones por NAs.
x <- c(1, 2, 3, 4, 5, NA, 1, 2, 3, NA, 1, 2, 3, 4, 5, 6, 7)
barplot(x)
Referencias


 Nube de datos
No hay comentarios:
Publicar un comentario