2022-02-07

How to calculate weighted average in Pivot Table in Excel

Title

Problem

We would like to calculate the weighted average in a pivot table in Excel.

In our example, using the mtcars data set, we want to calculate the mpg average weighted by dips.

Solution

Let's see two alternatives:

  • Option1: Adding a column.
    1. We add a new columng multiplying the variable (mpg) by the weights (disp)
    2. We create a Calculated Field dividing the new column (mpg*disp) by the weights (disp)
    3. We create a pivot table adding the Calculated Field.

  • Option 2: Using a DAX functions.
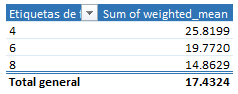
    1. We add the table to the Data Model.
    2. We create a new Measure.
    3. weighted_average:=SUMX( Table1,[mpg] * [disp]) / SUM([disp])
      
    4. We create a pivot table from Data Model as a data source adding the previous Measure.

    Related posts

    References

    2022-02-04

    Cómo calcular la media ponderada en tablas dinámicas en Excel

    Title

    Problema

    Queremos calcular la media ponderada dentro de una tabla dinámica en Excel.

    En nuestro ejemplo, usando el conjunto de datos mtcars , queremos calcular la media de mpg ponderada por disp.

    Solución

    Vamos a ver dos alternativas:

  • Opción 1: Mediante una columna auxiliar.
    1. Añadimos una columna auxiliar multiplicando la variable (mpg) por los pesos (disp)
    2. Creamos un campo calculado dividiendo la columna auxiliar (mpg*disp) por los pesos (disp)
    3. Creamos la tabla dinámica agrupando por el campo deseado

  • Opción 2: Con una fórmula DAX.
    1. Agregamos la tabla original al modelo de datos. No es necesario crear una columna auxiliar.
    2. Creamos una nueva medida
    3. weighted_average:=SUMX( Table1,[mpg] * [disp]) / SUM([disp])
      
    4. Creamos la tabla dinámica tomando como origen Desde Modelo de datos, usando la medida recién creada

    Entradas relacionadas

    Referencias

    2021-03-22

    Ignore zero values in conditional formatting in Excel

    Title

    Problem

    We want conditional formatting in Excel to ignore cells containing zero values. In the example below, after applying colour scales in conditional formatting, we can see that Excel applies red formatting to cells with zero values.

    Solution

    To make conditional formatting ignore zero values, we follow these steps:

    1. Create a new conditional formatting rule.
    2. Apply no format to cells with value equal to 0.
    3. Make sure that this rule is the first to be evaluated, and select the Stop If True check box.

    Results

    Related posts

    Formato condicional

    References

    Use conditional formatting to highlight information

    2021-03-19

    Ignorar ceros en el formato condicional en Excel

    Title

    Problema

    Queremos que Excel no aplique el formato condicional a las celdas cuyo valor sea 0. En el siguiente ejemplo vemos como, tras aplicar el formato condicional con escalas de colores, los ceros aparecen en rojo.

    Solución

    Para evitar que aplique un formato condicional a los ceros seguimos los siguientes pasos:

    1. Creamos una nueva regla.
    2. No aplicamos ningún formato a las celdas cuyo valor sea 0.
    3. Nos aseguramos de que es la primera regla evaluada y activamos la casilla Detener si es verdad.

    Resultado

    Entradas relacionadas

    Formato condicional

    2021-03-18

    Cómo representar funciones en R

    Problema

    Queremos representar funciones en R.

    Solución

    En nuestro ejemplo queremos representar la siguiente ecuación de segundo grado: 2x2 + 20x + 3 = 0

    • Opción 1: base package
    • f <- function(x) {
        x ^ 2 + 20 * x + 3
      }
      curve(expr = f, from = -100, to = 100)
      
    • Opción 2: ggplot2
    • library(ggplot2)
      ggplot(data.frame(x = c(-100, 100)), aes(x)) +
        stat_function(
          fun = function(x) {
            x ^ 2 + 20 * x + 3
          }
        ) +
        geom_hline(yintercept = 0) +
        geom_vline(xintercept = 0)


    Notas

    Si queremos añadir más funciones:

    • Opción 1: Base package
    • f1 <- function(x) {
        x ^ 2 + 20 * x + 3
      }
      f2 <- function(x) {
        x ^ 2 + 50 * x + 100
      }
      curve(expr = f1, from = -100, to = 100)
      curve(expr = f2, from = -100, to = 100, col  = 2, add = TRUE)
      
    • Opción 2: ggplot2
    • ggplot(data.frame(x = c(-100, 100)), aes(x)) +
        stat_function(
          fun = function(x) {
            x ^ 2 + 20 * x + 3
          }
        ) +
        stat_function(
          fun = function(x) {
            x ^ 2 + 50 * x + 100
          },
          colour = "red"
        ) +
        geom_hline(yintercept = 0) +
        geom_vline(xintercept = 0)
       

    Entradas relacionadas

    Referencias

    2021-03-16

    How to plot functions in R

    Problem

    We would like to plot functions in R.

    Solution

    In our example we will plot the following quadratic equation: 2x2 + 20x + 3 = 0

    • Option 1: base package
    • f <- function(x) {
        x ^ 2 + 20 * x + 3
      }
      curve(expr = f, from = -100, to = 100)
      
    • Option 2: ggplot2
    • library(ggplot2)
      ggplot(data.frame(x = c(-100, 100)), aes(x)) +
        stat_function(
          fun = function(x) {
            x ^ 2 + 20 * x + 3
          }
        ) +
        geom_hline(yintercept = 0) +
        geom_vline(xintercept = 0)


    Notes

    If we want to add more functions:

    • Option 1: Base package
    • f1 <- function(x) {
        x ^ 2 + 20 * x + 3
      }
      f2 <- function(x) {
        x ^ 2 + 50 * x + 100
      }
      curve(expr = f1, from = -100, to = 100)
      curve(expr = f2, from = -100, to = 100, col  = 2, add = TRUE)
      
    • Option 2: ggplot2
    • ggplot(data.frame(x = c(-100, 100)), aes(x)) +
        stat_function(
          fun = function(x) {
            x ^ 2 + 20 * x + 3
          }
        ) +
        stat_function(
          fun = function(x) {
            x ^ 2 + 50 * x + 100
          },
          colour = "red"
        ) +
        geom_hline(yintercept = 0) +
        geom_vline(xintercept = 0)
       

    References

    Nube de datos