Problem
In the following plot created using geom_tile we have rectangular cells. How can we draw squared cells instead?
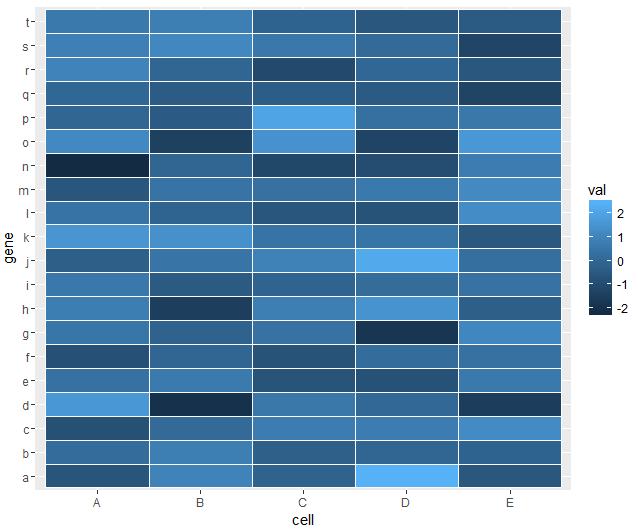
set.seed(1)
df <- data.frame(val = rnorm(100),
                 gene = rep(letters[1:20], 5),
                 cell = c(sapply(LETTERS[1:5],
                                 function(l) rep(l, 20))))
library(ggplot2)
ggplot(df, aes(y = gene, x = cell, fill = val)) +
  geom_tile(color = "white")
Soluction
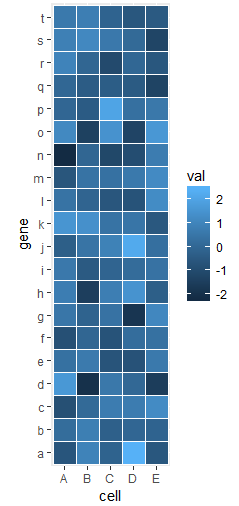
We add coord_fixed() or coord_equal( ):
The default, ratio = 1, ensures that one unit on the x-axis is the same length as one unit on the y-axis.
ggplot(df, aes(y = gene, x = cell, fill = val)) +
  geom_tile(color = "white") +
  coord_fixed() # or coord_equal()
References
Related posts
 Nube de datos
No hay comentarios:
Publicar un comentario