Problem
We want to create a loop and save plots for each subset of data using ggplot2. Instead of plotting on the same panel using facet_wrap o facet_grid, we'd like to display and save eachplot separately.
library(tidyverse)
p <- ggplot(iris, aes(Sepal.Length, Sepal.Width)) + geom_point()
p + facet_wrap(vars(Species), scales = "free")

Solution
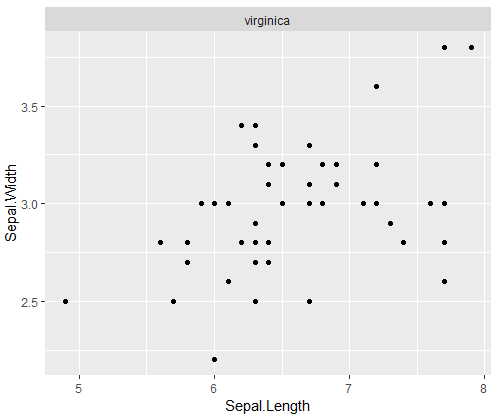
We create an empty list to store all plots. Then, we start a loop for each unique element of the variable (column) Species. To keep the same title format, we leave the function facet_wrap.
# Loop
plots <- list() # Empty list
p_list <- unique(iris$Species)
for (i in seq_along(p_list)) {
  # Plot for each Species
  p <- iris %>% filter(Species == p_list[i]) %>%
    ggplot(aes(Sepal.Length, Sepal.Width)) +
    geom_point() +
    facet_wrap( ~ Species) # Títulos
  plots[[i]] = p
  print(p)
}


# Print list
print(plots)
# Print an element of the list
print(plots[[1]])
Related posts
References
 Nube de datos
No hay comentarios:
Publicar un comentario